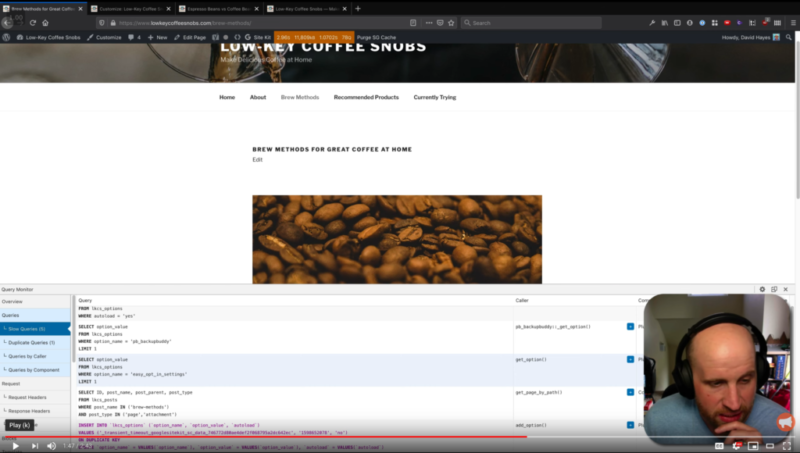
The topics of SQL and database performance optimization are important to a small percentage of WordPress sites. But when they matter, they matter a whole heck of a lot. It is in those situations that the WordPress plugin Query Monitor comes in. Maintained by John Blackbourn, Query Monitor is a great way to see what database queries were run on specific page of your site, and find out what the slow ones are. Once you find that, you’ve still got some work to do—tracking down the problematic query’s source, fixing the code that produced the query, etc—and unfortunately that work is far outside the scope of this little Quick Guide. All that said, let’s cover the basics of how to start to understand what’s going on with the WordPress Query Monitor plugin.
Video Guide to Getting Started with Query Monitor for WordPress
As mentioned, we can’t cover the whole of SQL optimization in this Quick Guide, but here’s the start of the process using Query Monitor:
Basics of Installing and Using Query Monitor for WordPress
- Like every new plugin installation, you’ll want to navigate the administration area of your WordPress site to the “Plugins > Add New” page you can find in the left-sidebar. Once there, you’ll do a search for the “Query Monitor” plugin.
- On the “Query Monitor” plugin you’ll want to hit the “Install” button. After WordPress downloads and installs the plugin, you’ll want to also hit “Activate.”
- At this point, the plugin is totally ready to use. To see results, you’ll want to navigate to a specific page (while logged in as an Administrator of your WordPress site) and look in the Admin bar on that page. You’ll see a big block toward the middle that probably looks like a random assortment of numbers and letters. Mine is pictured at right. This is from the Query Monitor plugin working in the background as you load the page. You’ll notice that not only can you click through from that hover-menu to see what database/SQL queries were run to build the page, but you can also see a WHOLE LOT MORE. If you’re a developer, this is freaking awesome. If you’re not, this is probably where you decide Query Monitor isn’t for you ;p (no judgement either way ❤️)
- If QM is for you, you’ll probably have wanted to install Query Monitor to find out why a specific WordPress page is slow. Truly really getting to the root of that is beyond the scope of this article (or really anything other than an “SQL for WordPress” course, which if you’re interested in sound off in the comments). But to get started you’ll want to click on “Queries” from the dropdown menu. That’ll bring up a view (sort of like your browser’s “Web Inspector”) at the bottom of the page with all the database queries WordPress used to build the current page for you, and how long they took to complete.
Once you’ve seen the results of Query Monitor, you’re outside of what I think reasonable to cover here. The Query Monitor plugin itself would be the great basis of a whole little mini-course about what all you’re seeing means (again, sound off in the comments if that interests you), but for now just realize how freaking powerful and cool this is! Best of luck ?
Keep reading the article at WPShout. The article was originally written by David Hayes on 2020-09-10 12:37:56.
The article was hand-picked and curated for you by the Editorial Team of WP Archives.

